Alerting
Table of Contents
- Main Steps When Creating a New Alert Rule
- Additional Alert Settings
- Supported Data Sources for Alerting
- Setting Up Alerts in Grafana Using Built-in Alerting
- Setting Up Alerts as Code (Helm Chart)
- Requesting a Slack Contact Point
- References
Main Steps When Creating a New Alert Rule
When creating a new alert rule in Grafana, follow these main steps:
- Enter alert rule name
- Define query and alert condition
- Add folder and labels
- Set evaluation behavior (e.g., check interval, no data handling)
- Configure notifications (choose Slack as the contact point)
- Configure notification message (customize the message sent with the alert)
Additional Alert Settings
When configuring alerts in Grafana, there are a few important settings to consider:
- Check interval: This determines how often Grafana evaluates the alert rule (e.g., every 1 minute). Set this according to how quickly you want to detect issues.
- No data handling: Decide what should happen if no data is returned by the query. It is recommended to treat “no data” as OK to avoid unnecessary or false alarms, especially for metrics or logs that may not always be present. However, be aware that this means you might miss some issues if data stops unexpectedly.
Recommendation: Set “no data” to OK/Normal unless you have a specific reason to treat it as an alert. Always review this setting based on your use case.
Supported Data Sources for Alerting
Grafana alerts can be created based on data from different sources:
- Prometheus metrics: You can create alerts directly on Prometheus metric queries.
- Loki log lines: You can also create alerts based on queries against Loki logs. However, to use Loki log lines for alerting, your query must produce a numeric value (for example, by using functions like
count()orsum()in your query). Only numeric results can be used as the basis for alert conditions.
Setting Up Alerts in Grafana Using Built-in Alerting
This guide explains how to set up alerts in Grafana using:
- The Alerting menu (recommended for most use cases)
- Dashboards (for panel-specific alerts)
Grafana’s built-in alerting allows you to monitor your data and receive notifications when certain conditions are met.
General Prerequisites
- Sufficient permissions to create alerts in Grafana
- A Slack contact point configured for your team (see Requesting a Slack Contact Point)
- Access to your team’s monitoring data sources
Setting Up Alerts via the Alerting Menu (Recommended)
Steps
- Log in to Grafana
- Open your Grafana instance in a browser and log in.
- Go to Alerting > Alert rules
- In the left menu, click on “Alerting” and then select “Alert rules”.
- Click the “New alert rule” button to start creating a new alert rule.
- Define the Alert Rule
- Enter a name for your alert rule.
- Define your query and alert condition (choose your data source, write your query, and set the condition).
- Add a folder and any relevant labels (e.g.,
severity). - Set evaluation behavior (check interval, no data handling—see recommendations above).
- Configure notifications by selecting your team’s dedicated Slack contact point.
- Optionally, customize the notification message.
- Save the Alert Rule
- Click “Save” to create the alert rule.
- Test the Alert
- If possible trigger the alert condition to verify notifications are sent as expected.
Example: Creating an Alert Rule via the GUI
Note: The following example is a fictional scenario and may not represent a meaningful or recommended real-world alert rule. The images are for guidance only; the Grafana GUI may change over time and the guide may not always reflect the latest interface. The most important elements are highlighted with red boxes in the screenshots to help you identify key areas.
Example scenario: This alert monitors the nginx-public ingress controller for HTTP 4xx responses within the last 15 minutes. If more than 150 such responses are detected, a Slack alert is sent to the contact point for our LAP team’s dev environment.
Below is an example walkthrough with screenshots illustrating the process:
-
Navigate to Alert Rules and choose New alert rule
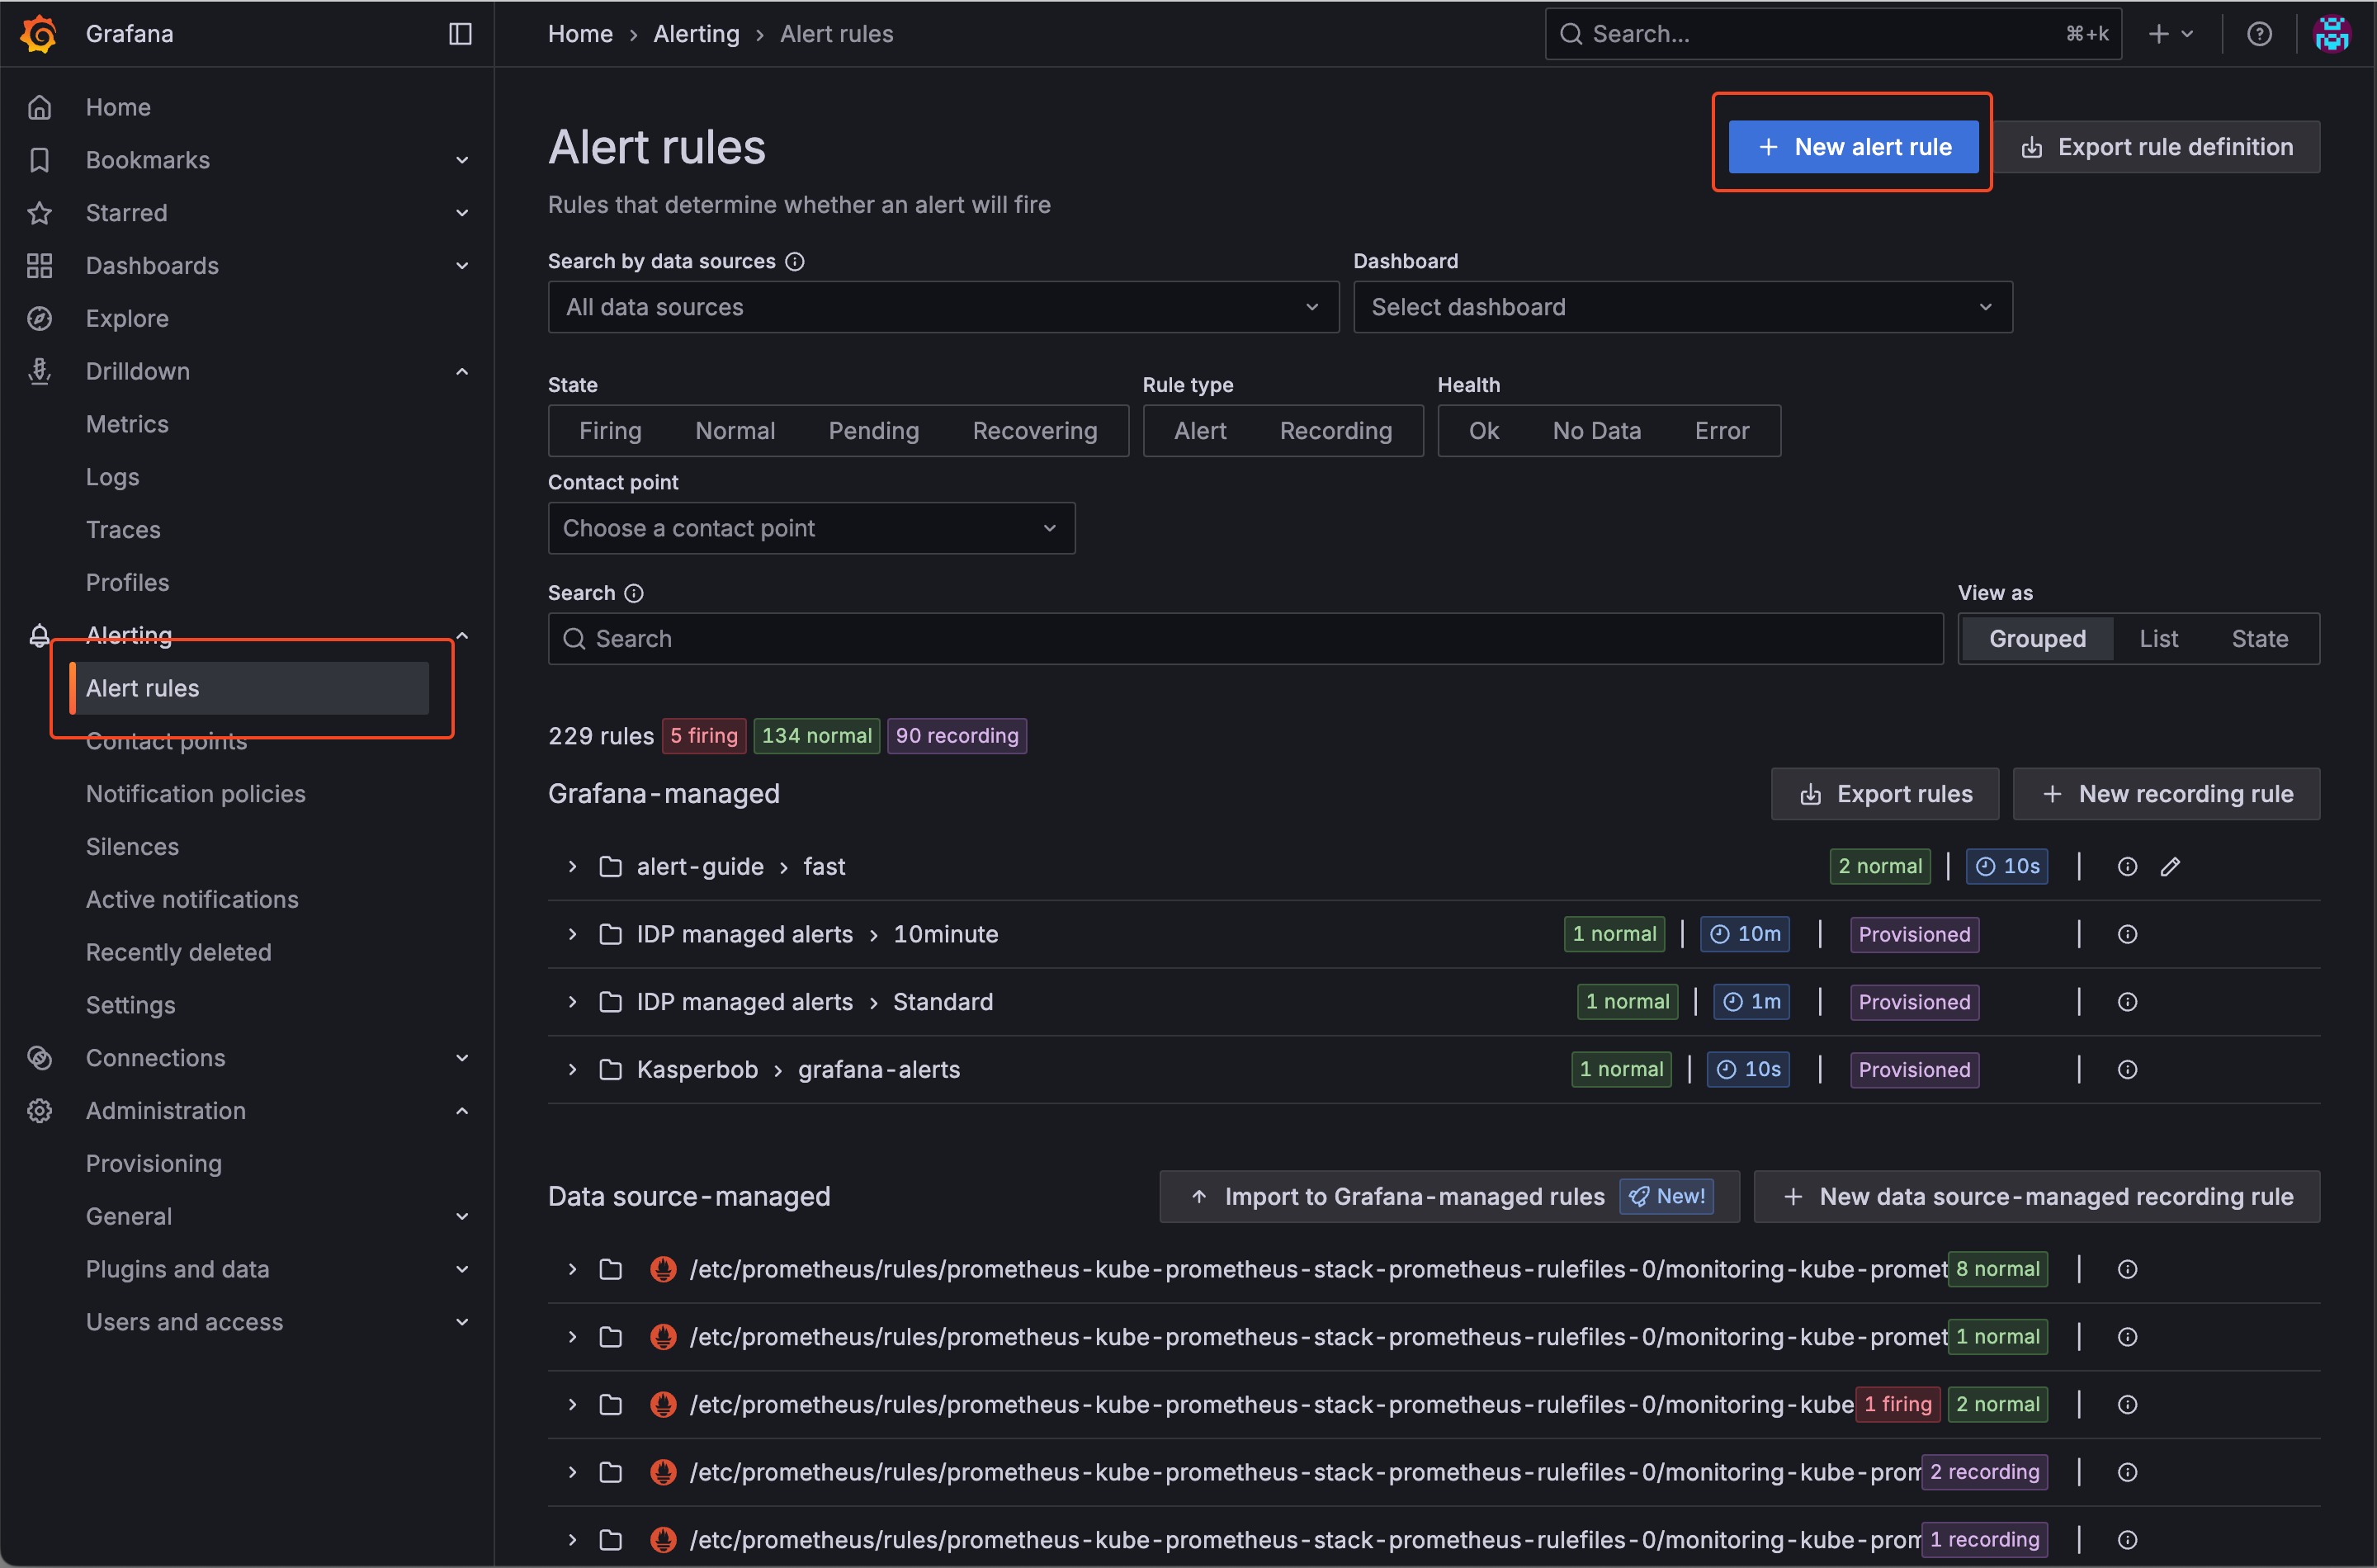
-
Configure alert
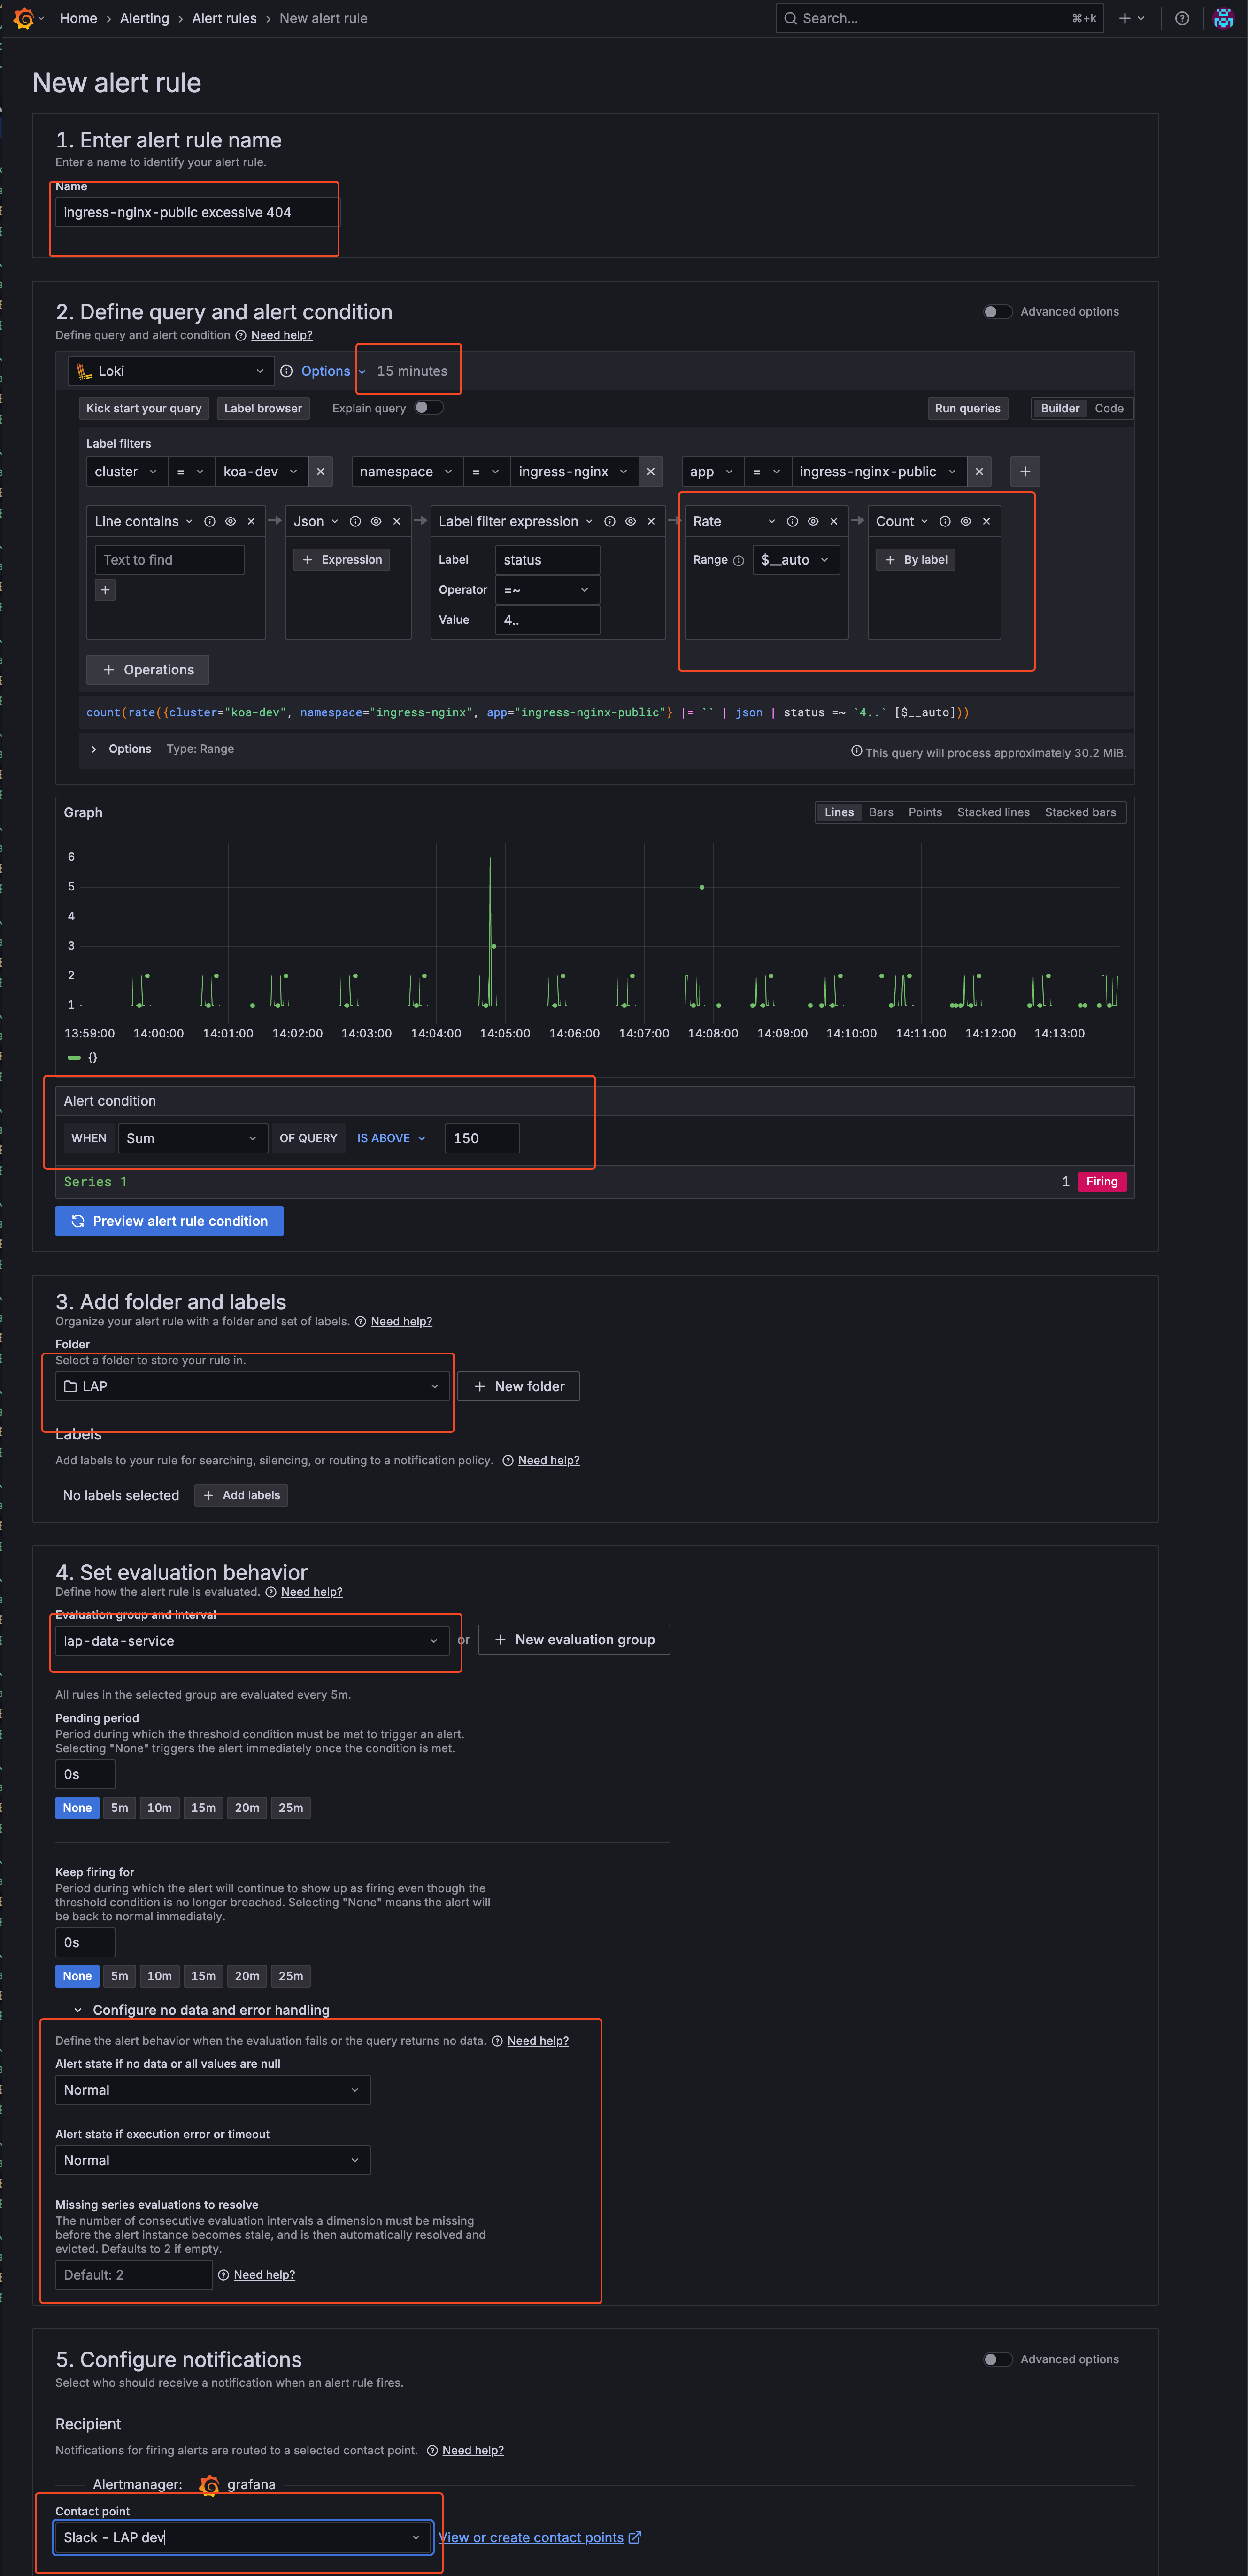
- Configure Evaluation Group You can define an existing evaluation group or create a new one. In this example, I’m using an existing evaluation group created by the LAP team.
- If creating new: Set evaluation interval and folder location
- If using existing: Select from the dropdown menu
- Save and Verify
- Click “Save and exit” to create the alert rule
- Your alert is now active and will appear in the Alert Rules list
- The alert will begin evaluating based on your configured interval
-
Example: Alert in Slack
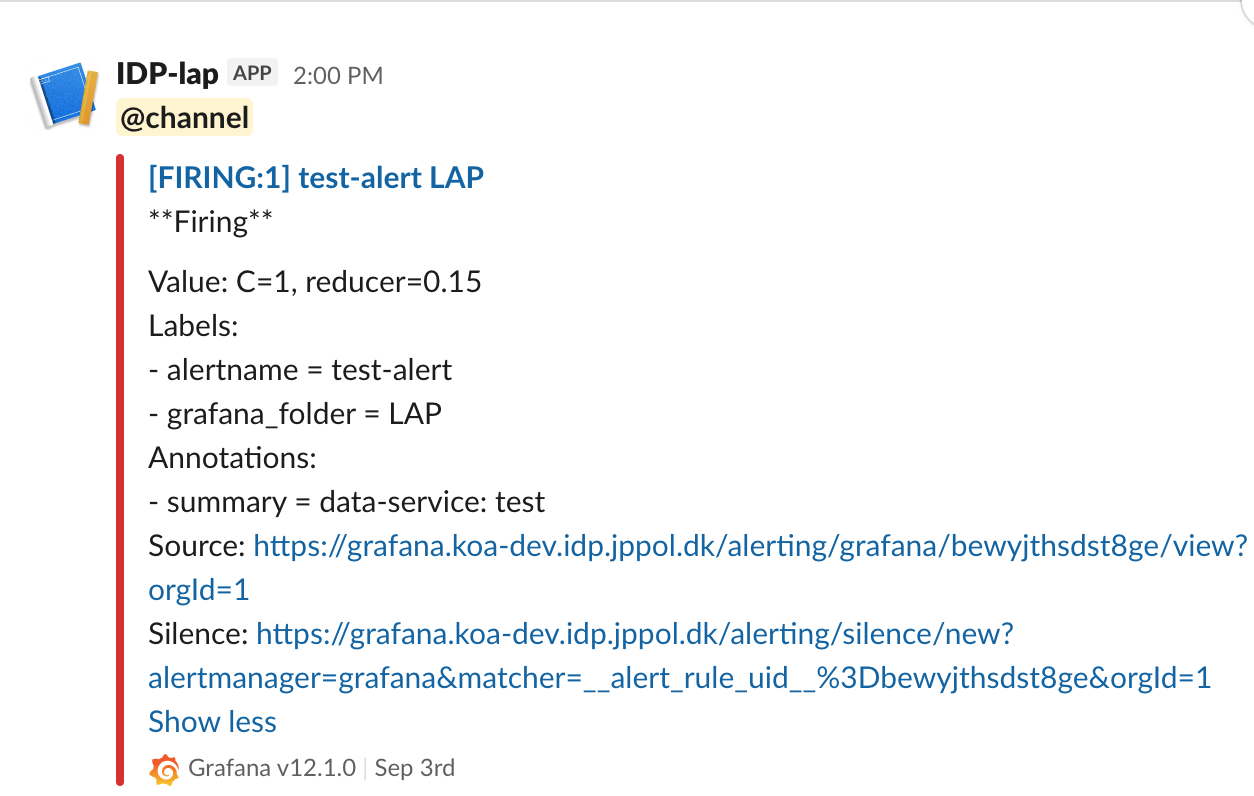
This is how an alert would appear in the relevant Slack channel when triggered.
Setting Up Alerts via a Dashboard Panel
Steps
-
Log in to Grafana
- Create or Open a Dashboard
- Navigate to the dashboard where you want to add an alert.
- You can create a new dashboard or use an existing one.
- Add a Panel
- Click on “Add panel” and configure your query as needed.
- Configure Alert
- In the panel editor, go to the “Alert” tab.
- Click “Create alert rule”.
- Set the conditions for your alert (e.g., when a metric is above/below a threshold).
- Configure evaluation interval and other settings.
- Set Notification Channel
- Under “Notifications”, select your Slack integration as the notification channel. Alerts will be sent to the predefined Slack channel configured in the integration.
- Add Labels to the Alert
- You can add standard labels to your alert for categorization and organization:
severity: Indicate the importance of the alert (e.g.,critical,warning)
- Example:
labels: severity: "critical" - These labels help with alert organization and filtering in the Grafana interface.
- You can add standard labels to your alert for categorization and organization:
- Save the Panel
- Click “Apply” to save the panel and alert rule.
- Test the Alert
- Trigger the alert condition to verify notifications are sent as expected.
Setting Up Alerts as Code (Helm Chart)
The idp-grafana-alarm Helm chart lets you manage Grafana alert rules as code via Kubernetes CRDs. Alerts are deployed through ArgoCD and automatically synced to Grafana via the grafana-operator.
The recommended workflow is: create and test in the GUI first, then export and convert to Helm values for permanent deployment.
Prerequisites
- A working alert rule tested in the Grafana GUI
- A Slack contact point configured for your team (see Requesting a Slack Contact Point)
- Access to your team’s apps repository (e.g.,
apps-idp)
Step 1: Create and Test in the GUI
Follow the steps in the sections above to create your alert rule in the Grafana UI. Make sure the alert fires correctly and notifications arrive in your Slack channel before proceeding.
Step 2: Export the Alert Rule
- In Grafana, go to Alerting > Alert rules
- Find your alert rule and click on it to open the details
- Click the Export button and choose the YAML tab
- Click Copy code or Download
The exported YAML looks like this:
apiVersion: 1
groups:
  - orgId: 1
    name: my-alert-group
    folder: My Folder
    interval: 1m
    rules:
      - uid: abc123xyz
        title: High Error Rate
        condition: C
        data:
          - refId: A
            relativeTimeRange:
              from: 600
              to: 0
            datasourceUid: prometheus
            model:
              datasource:
                type: prometheus
                uid: prometheus
              expr: 'rate(http_requests_total{status=~"5.."}[5m]) > 0.1'
              instant: true
              range: false
              refId: A
          - refId: C
            datasourceUid: __expr__
            model:
              conditions:
                - evaluator:
                    params:
                      - 0
                    type: gt
                  operator:
                    type: and
                  query:
                    params:
                      - A
                  reducer:
                    params: []
                    type: last
                  type: query
              datasource:
                type: __expr__
                uid: __expr__
              expression: A
              refId: C
              type: threshold
        noDataState: OK
        execErrState: OK
        for: 5m
        annotations:
          summary: "High error rate detected"
        labels:
          severity: warning
        isPaused: false
        notification_settings:
          receiver: "Slack - My Team"
Step 3: Create Helm Values
The exported YAML maps directly to the chart’s values.yaml. You only need to:
- Remove the wrapper lines (
apiVersion,groups,orgId,folder) - Add
folderandintervalat the top - Paste the
rulesblock as-is — no changes needed, includingnotification_settings
# Choose ONE of these folder options:

# Option A: Create a new folder for your team's alerts
folder: "My Team Alerts"

# Option B: Use an existing folder (set folder to empty, specify folderRef)
# folder: ""
# folderRef: "idp-managed-alerts"

# Evaluation interval (from groups[].interval in the export)
interval: 1m

# Paste rules directly from the export — no modifications needed
rules:
  - uid: abc123xyz
    title: High Error Rate
    condition: C
    data:
      - refId: A
        relativeTimeRange:
          from: 600
          to: 0
        datasourceUid: prometheus
        model:
          datasource:
            type: prometheus
            uid: prometheus
          expr: 'rate(http_requests_total{status=~"5.."}[5m]) > 0.1'
          instant: true
          range: false
          refId: A
      - refId: C
        datasourceUid: __expr__
        model:
          conditions:
            - evaluator:
                params:
                  - 0
                type: gt
              operator:
                type: and
              query:
                params:
                  - A
              reducer:
                params: []
                type: last
              type: query
          datasource:
            type: __expr__
            uid: __expr__
          expression: A
          refId: C
          type: threshold
    noDataState: OK
    execErrState: OK
    for: 5m
    annotations:
      summary: "High error rate detected"
    labels:
      severity: warning
    isPaused: false
    notification_settings:
      receiver: "Slack - My Team"
To add more alerts later, simply append additional rules to the rules list and push the change.
Using Multiple Alert Groups
If you need alerts with different evaluation intervals, or want to organize alerts into separate groups (as they appear in the Grafana UI), use the groups key instead of (or alongside) rules:
folder: "My Team Alerts"

groups:
  - name: critical-alerts
    interval: 30s
    rules:
      - uid: svc-down-001
        title: Service Down
        condition: C
        for: 0s
        notification_settings:
          receiver: "Slack - My Team"
        data:
          - refId: A
            relativeTimeRange:
              from: 600
              to: 0
            datasourceUid: prometheus
            model:
              expr: up{namespace="my-team"} == 0
              instant: true
              refId: A
          - refId: C
            datasourceUid: __expr__
            model:
              conditions:
                - evaluator:
                    params: [0]
                    type: gt
                  operator:
                    type: and
                  query:
                    params: [A]
                  reducer:
                    params: []
                    type: last
                  type: query
              datasource:
                type: __expr__
                uid: __expr__
              expression: A
              refId: C
              type: threshold

  - name: warning-alerts
    interval: 5m
    rules:
      - uid: high-mem-001
        title: High Memory Usage
        condition: C
        for: 10m
        notification_settings:
          receiver: "Slack - My Team"
        data:
          - refId: A
            relativeTimeRange:
              from: 600
              to: 0
            datasourceUid: prometheus
            model:
              expr: container_memory_working_set_bytes{namespace="my-team"} > 1e9
              instant: true
              refId: A
          - refId: C
            datasourceUid: __expr__
            model:
              conditions:
                - evaluator:
                    params: [0]
                    type: gt
                  operator:
                    type: and
                  query:
                    params: [A]
                  reducer:
                    params: []
                    type: last
                  type: query
              datasource:
                type: __expr__
                uid: __expr__
              expression: A
              refId: C
              type: threshold
Each group becomes a separate alert rule group in Grafana with its own name and evaluation interval. You can also use groups alongside the top-level rules key — rules creates one group named after the Helm release, and groups creates additional named groups.
Tip: When exporting multiple groups from the Grafana UI, each
groups[]entry in the export maps directly to an entry in thegroupslist. Just copy thename,interval, andrulesfrom each.
Step 4: Deploy via ArgoCD
-
In your apps repository (e.g.,
apps-idp), create a directory for your alerts underapps/<namespace>/:application.yaml:apiVersion: v2 name: my-team-alerts description: Grafana alerts for my team version: 0.1.0 helm: chart: helm/idp-grafana-alarm chartVersion: "1.0.1" # see latest version at https://github.com/jppol-idp/helm-idp/releases -
Add the
values.yamlyou created in step 3 -
Commit and push to
main— ArgoCD will deploy the alert rules automatically
Deleting an Alert
With the grafana-operator approach, deleting alerts is straightforward: simply remove the alert rule from your values.yaml (or remove the entire ArgoCD application) and push the change. The grafana-operator handles cleanup automatically via Kubernetes finalizers — no special delete manifests needed.
Requesting a Slack Contact Point
Each team has a dedicated Slack contact point per environment that IDP provisions on your behalf. Webhooks and the Slack app are centrally governed by the IDP team — you don’t need to bring your own webhook URL.
To request contact points, reach out to the IDP team on Slack with:
- Your team or product name
- The Slack channel alerts should post to, per environment (e.g.
#myteam-dev-alerts,#myteam-test-alerts,#myteam-prod-alerts)
The IDP team sets up the webhook, creates the GrafanaContactPoint in your cluster(s), and lets you know the exact receiver name (typically "Slack - <Team> <env>") to use in your alert rules.
The same contact point serves all three sources of alerts — idp-managed-customer-alerts (IDP’s curated standard alerts), idp-grafana-alarm (your own alerts-as-code), and any manual alerts you create in the Grafana UI — so all alerts routed to the contact point share the same Slack channel and message format.
References
If you have any questions, refer to the official Grafana documentation or contact the IDP team.