Last reviewed: 2026-04-05
From code to deploy in 30 minutes 🚀
This guide helps you quickly deploy your first application to the developer platform.
By the end of this session, you will have:
- Your code packaged as a container
- Deployed via GitOps with visibility in Argo CD
- Monitoring via Prometheus, logging via Loki, and visualization in Grafana
- You comply with the platform’s security requirements
- You are ready to use IDP in your daily work
⏱️ Prerequisites
Before you begin, make sure you have the following in place:
- Access to your IDP onboarding channel on Slack
#idp-TEAM-onboardingand#idp-announcements - Access to your IDP deployment repository on GitHub
https://github.com/jppol-idp/apps-TEAM - Access to your IDP tools, Argo CD and Grafana. Check your links at
https://github.com/jppol-idp/apps-TEAM/tree/main/apps/TEAM-dev - Access to your own code repository, e.g.,
https://github.com/TEAM - Docker or similar installed
Note: To get access to IDP make a request in your #idp-TEAM-onboarding channel.
🪛 Step-by-Step: Deploy Your First Workload
1. 📁 Create an app in your own code repository
See example https://github.com/jppol-idp/generic-service
Tip: Name the app after yourself to make it easy to identify.
mkdir app-name && cd app-name
echo 'print("Hello, IDP!")' > app-name.py
Add a Dockerfile:
FROM python:3.11-slim
WORKDIR /app-name
COPY app-name.py .
CMD ["python", "app-name.py"]
2. 🐳 Build and optionally test your image locally
docker build . -t app-name.py:0.1.0
docker run app-name.py:0.1.0
3. Upload your image to the IDP ECR repository
🚨 You typically don’t have permission to upload images directly — but your GitHub organization does.
This GitHub Action tags and pushes your image to ECR in our idp-shared account: 354918371398 https://github.com/jppol-idp/tag-and-push-ecr/blob/main/action.yaml
The ECR repository allows GitHub Actions from your organization to upload images to a namespaced registry. For instance, Actions from Politiken’s organization is allowed to push images to: arn:aws:ecr:eu-west-1:354918371398:repository/pol/*.
For an example on how to use it, view the generic-service.
To both build an image and to tag and push it you can use this GitHub Action. https://github.com/jppol-idp/build-and-push-ecr
4. Create deployment configuration
Prepare a Helm chart in the deploy repo: https://github.com/jppol-idp/apps-TEAM
git clone https://github.com/jppol-idp/apps-TEAM.git
cd apps-TEAM/apps/TEAM-dev
mkdir app-name
A deployment typically consists of two files:
application.yaml - describes the Helm chart:
apiVersion: v2
name: app-name
description: my first idp app
version: 0.1.0    # <-- version af deployment definition

helm:
  chart: helm/idp-advanced
  chartVersion: "3.6.0"    # <-- version af helm chart
The chart helm/idp-advanced refers to jppol-idp/helm-idp-advanced
values.yaml- defines deployment-specific variables:
image:
  repository: 354918371398.dkr.ecr.eu-west-1.amazonaws.com/pol/app
  pullPolicy: IfNotPresent
  tag: "0.1.0"
Find a list of all configurable variables or see examples in our generic service that covers most common needs.
Automatic deployment
The ECR repository uses immutable tags, meaning you can’t use latest as a tag for your images.
But, the IDP cluster can update to the latest version of the images built, optionally limiting to tags matching certain SemVer or Regex patterns.
This feature is enabled in application.yaml with a set of annotations. Enabling this feature will limit the need to modify the deploy repository, as you only need to modify it in case of entirely new deployments or when tweaking the configuration. Read more about auto updating images.
5. 📦 Commit and push to your GitOps repo and see deployment in Argo CD
After committing your application.yaml and values.yaml files to your /jppol-idp/apps-TEAM github repository deployment will start.
Check in Argo CD if your app has been synchronised and deployed and a certificate been issued.
Go to Argo CD for deployment. Check your link at https://github.com/jppol-idp/apps-TEAM/tree/main/apps/TEAM-dev
6. Confirm log output in Grafana
Metrics are automatically exposed with Prometheus and Loki and are visible in Grafana.
Go to Grafana for monitoring. Check your link at https://github.com/jppol-idp/apps-TEAM/tree/main/apps/TEAM-dev
Go to drilldown to see your Prometheus stats 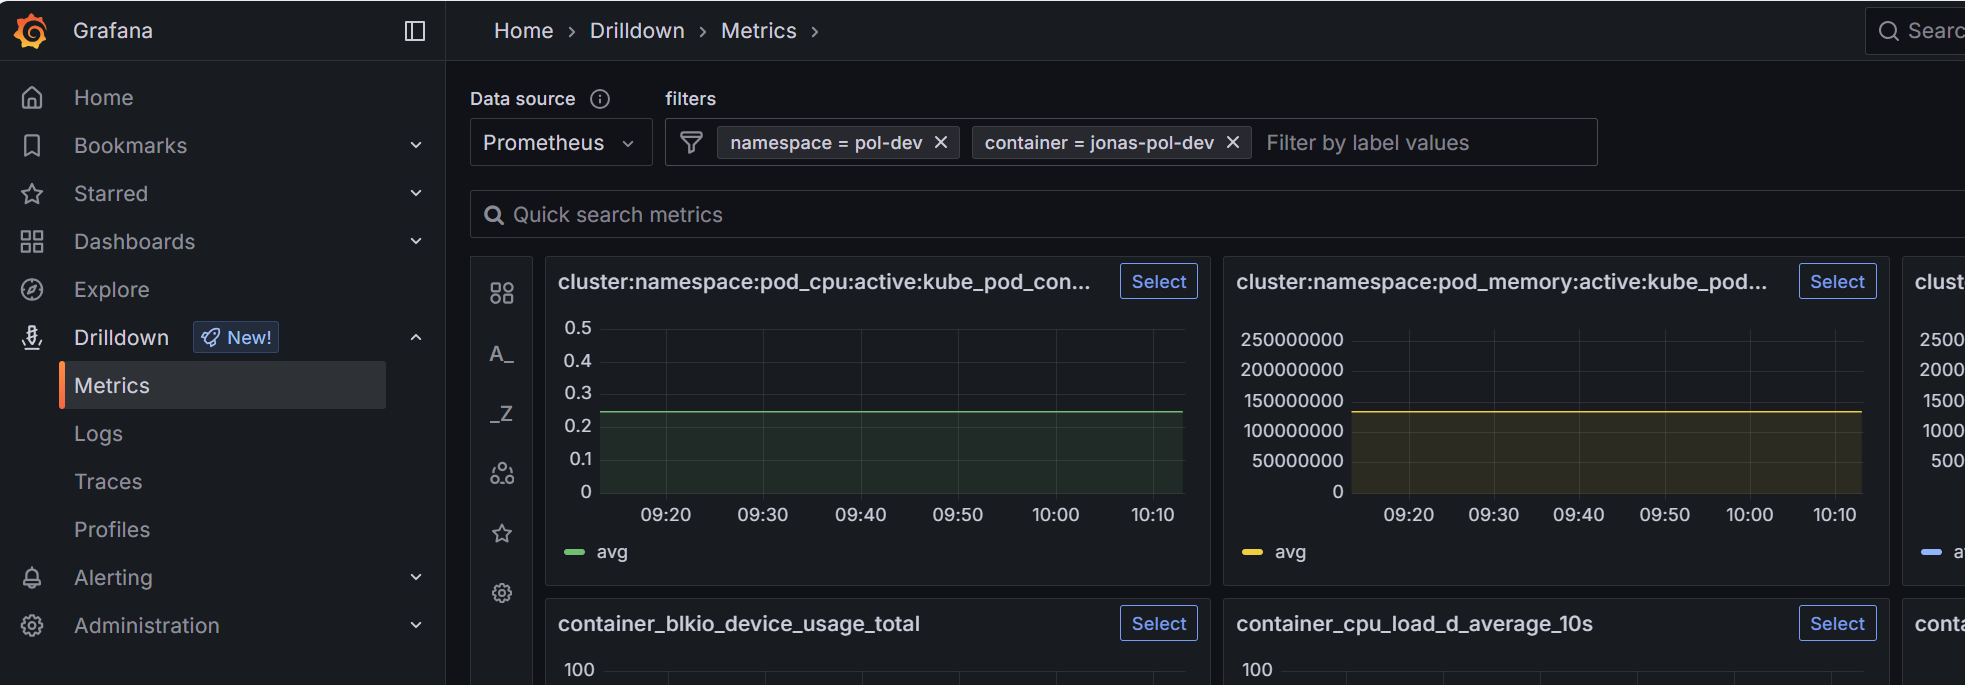
Go and drilldown and filter your logs with Loki 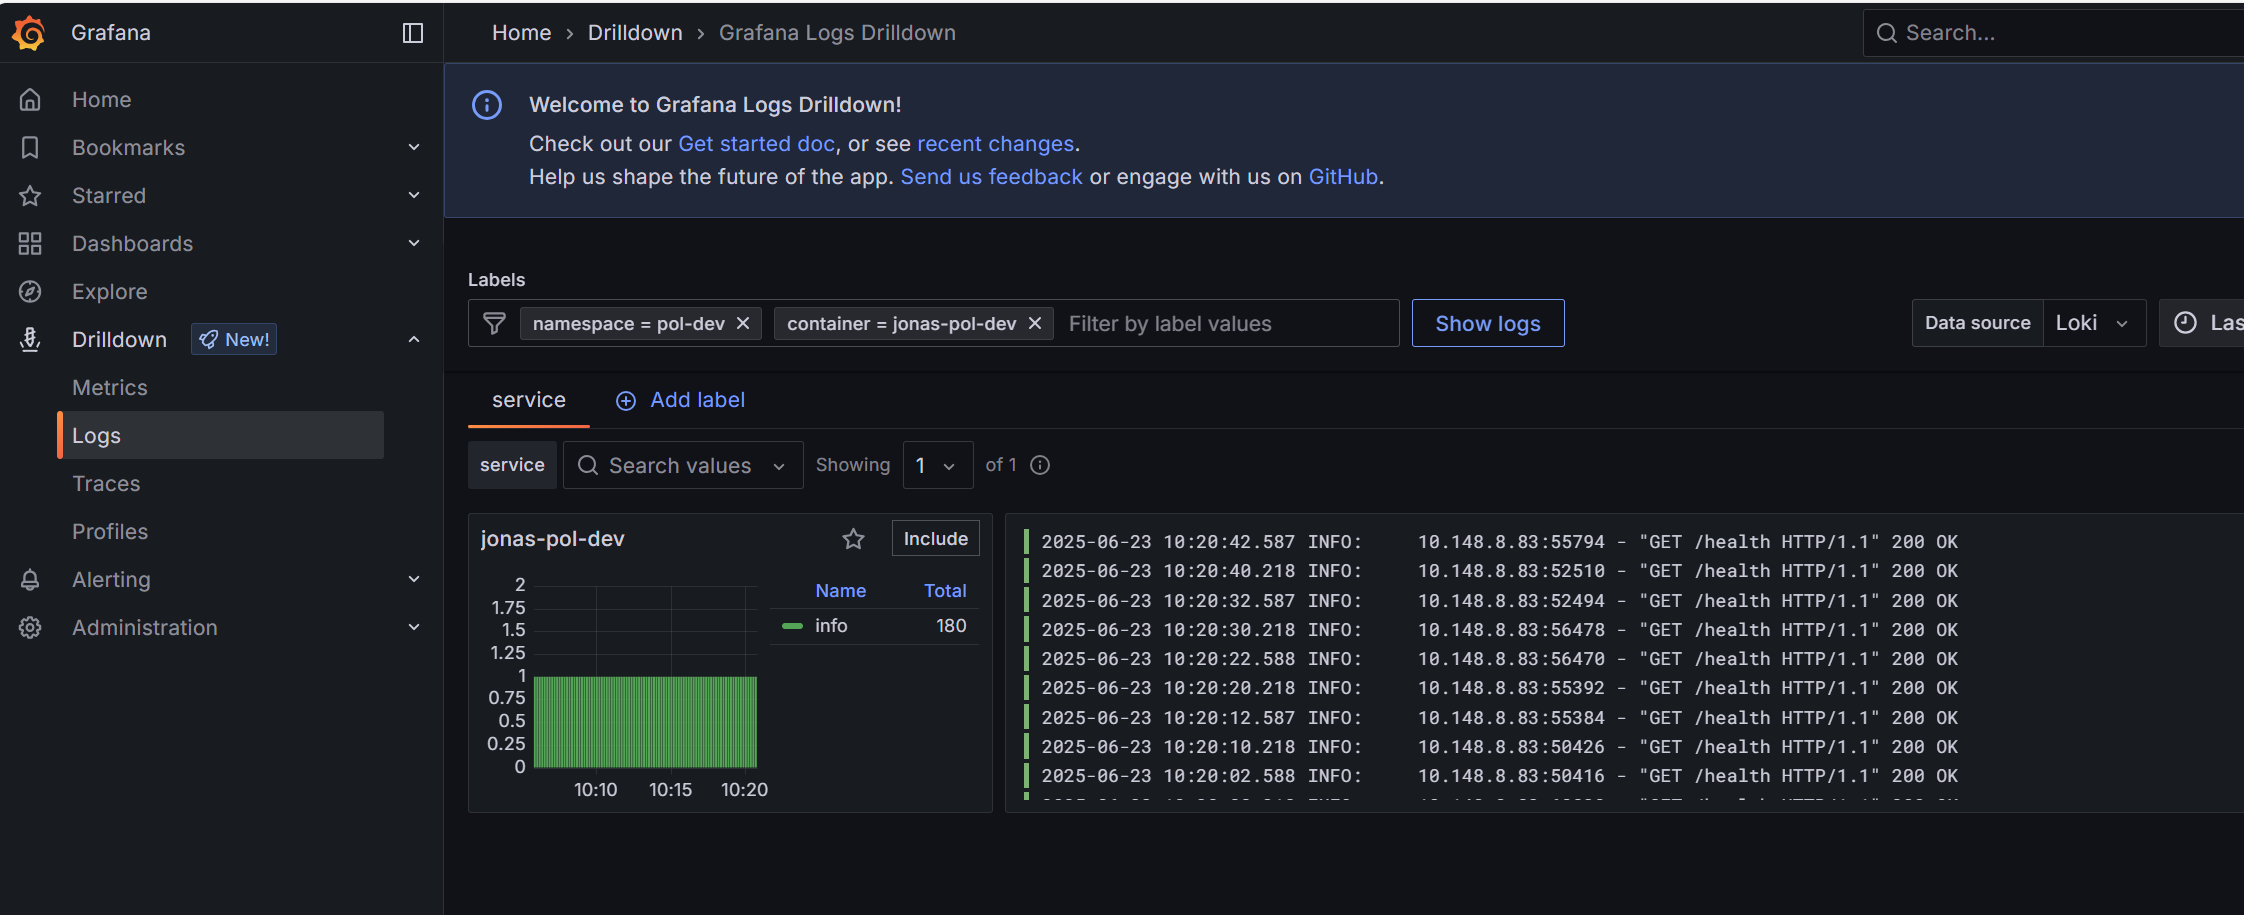
7. 🏁 Congratulations
You’re now up and running! 💪
You are always very welcome to ask questions in your onboarding channel on Slack - we’re happy to help!
Also, feel free to explore our How to section for further guidance.